- Ace in the Hole
- Posts
- Ace in the Hole - Edition #6
Happy Monday Traders!
I hope everybody had an amazing weekend!
Last week was crazy for the market, hitting new all time highs on $SPY with a closing price on Friday of $482.43 and previous all time high being $479.98.
$QQQ also made new all time highs once again and stocks such as $MSFT and $AAPL had notable gains.
Interesting enough $TSLA performed poorly during all of this and we have earnings for $TSLA on Wednesday.
How Should Day Traders/Investors React To This?
From a day trading perspective, this has been beautiful price action for us to capitalize on throughout the intraday. Tuesday and Wednesday were choppy, but Thursday and Friday made up for that choppiness with strong trends.
Keep playing your plan and play with the trend when it is there intraday. If it’s not there it might be better to just sit out.
As an investor, you’re probably smiling looking at your long-term portfolio. So am I!
I do want to be realistic though. At this point in time I have no desire to sell any positions of mine, but I do think if you were thinking about doing it this might be a good time.
We’ve seen $QQQ, $AAPL, and $MSFT all make new all time highs and then pull back, so i’m wondering if we see something similar on $SPY.
Doesn’t mean we will for sure, but i’m just keeping an open mind and trying to be realistic. Either way i’m holding my positions and will look to hedge them with selling covered calls and or buying $SQQQ.

Short-Term Setups For This Week:
1. $AMZN
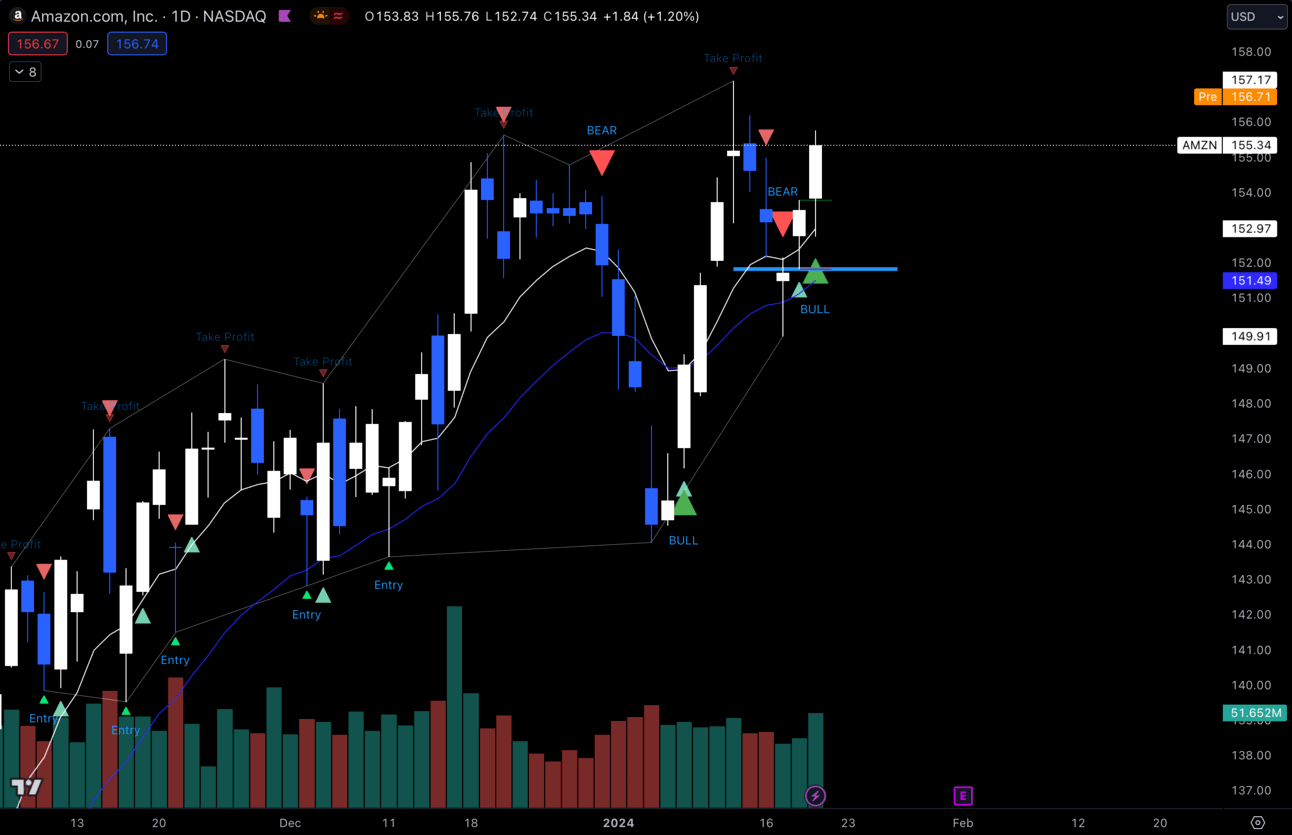
$AMZN Daily
$AMZN has been looking strong off of my daily EMAs. Higher highs and higher lows being made and with the market making all time highs I definitely think its possible for this to at least breakout of this range.
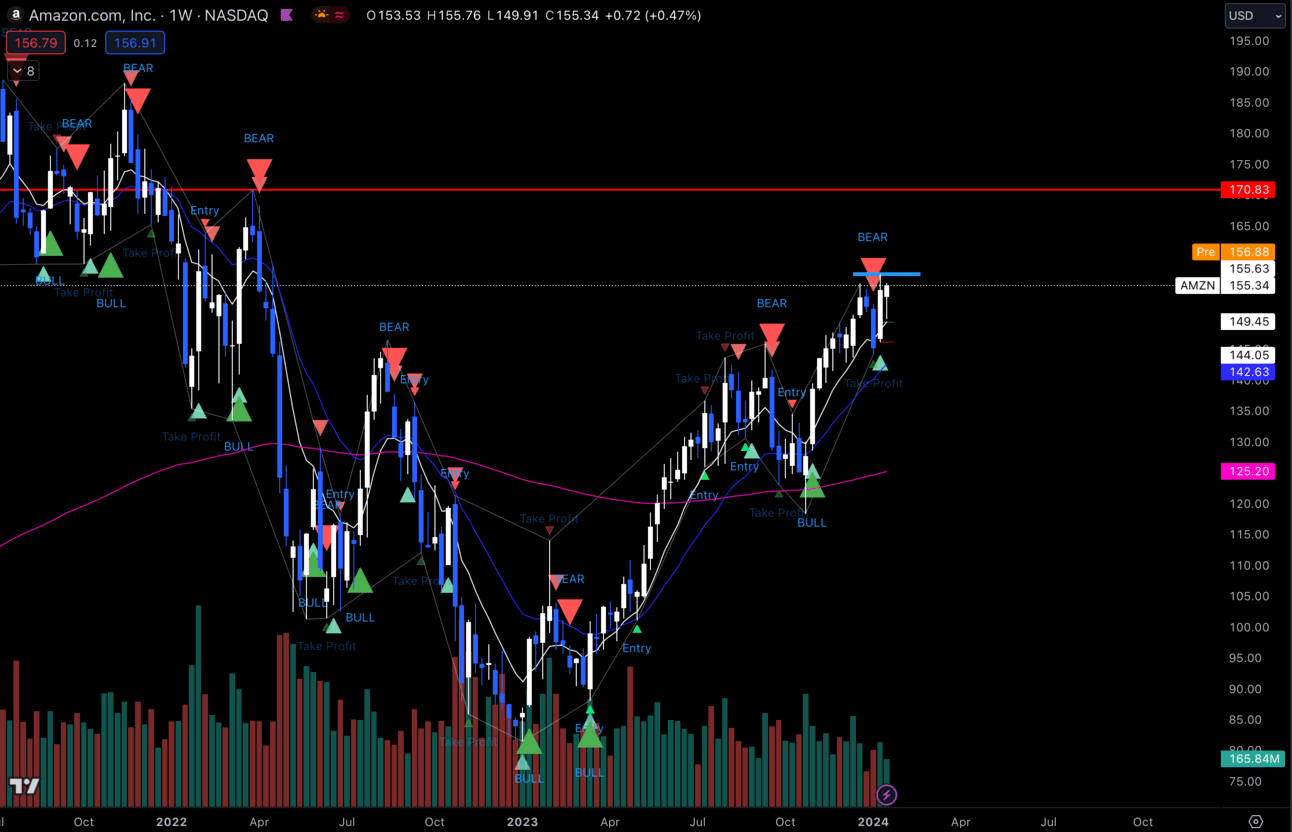
$AMZN Weekly
Zooming out to the weekly chart I see a big level of resistance at $170.83 which is where we sold off back in March of 2022.
If we can break out of the daily range I think this would be the next big spot we hit because I don’t see much heavy resistance up until then.
2. $ADBE
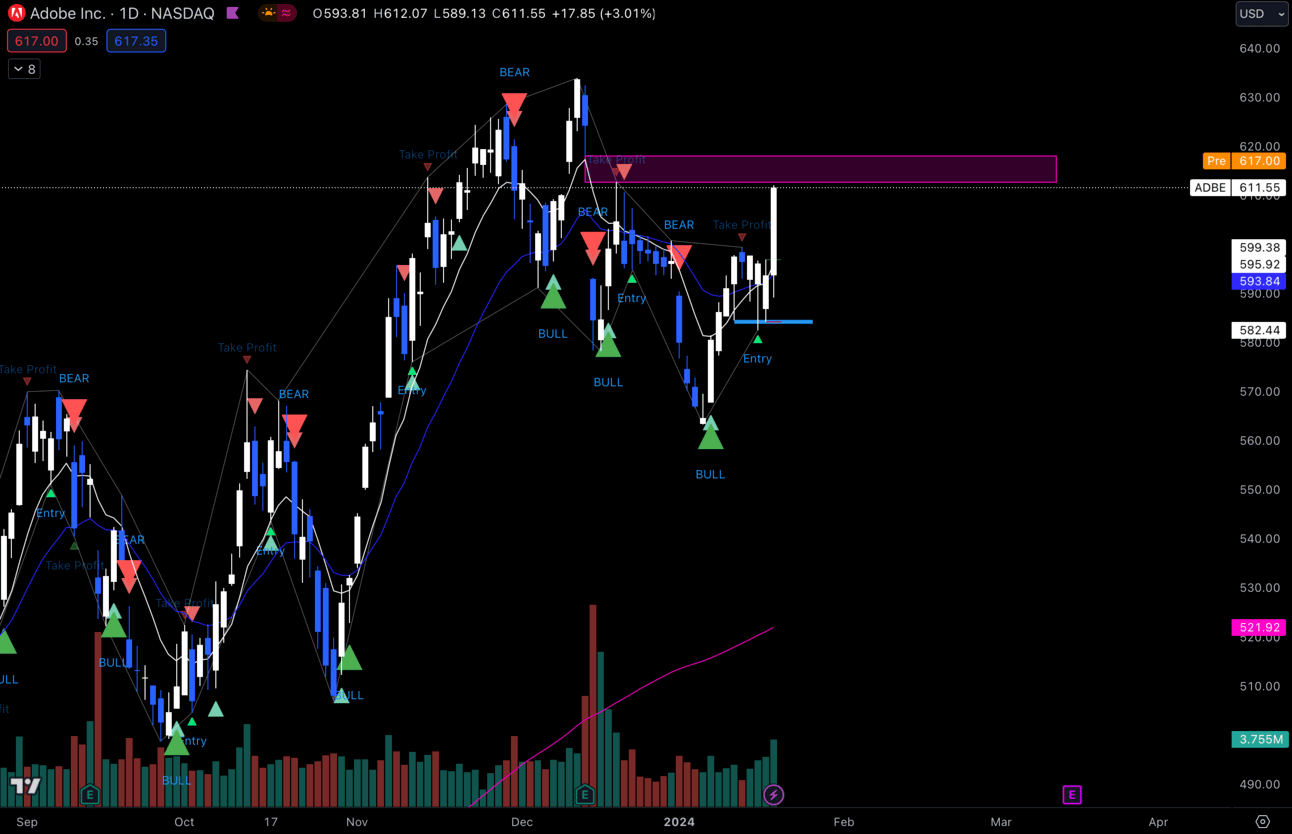
$ADBE Daily
The $ADBE daily chart is looking super healthy to me. Strong bounce off my 9 EMA making a higher low. There is this gap right above us from $612.71 —> 618.03.
I’m watching to see if this gap gets filled and it continues for the breakout or at least test the top of the range.
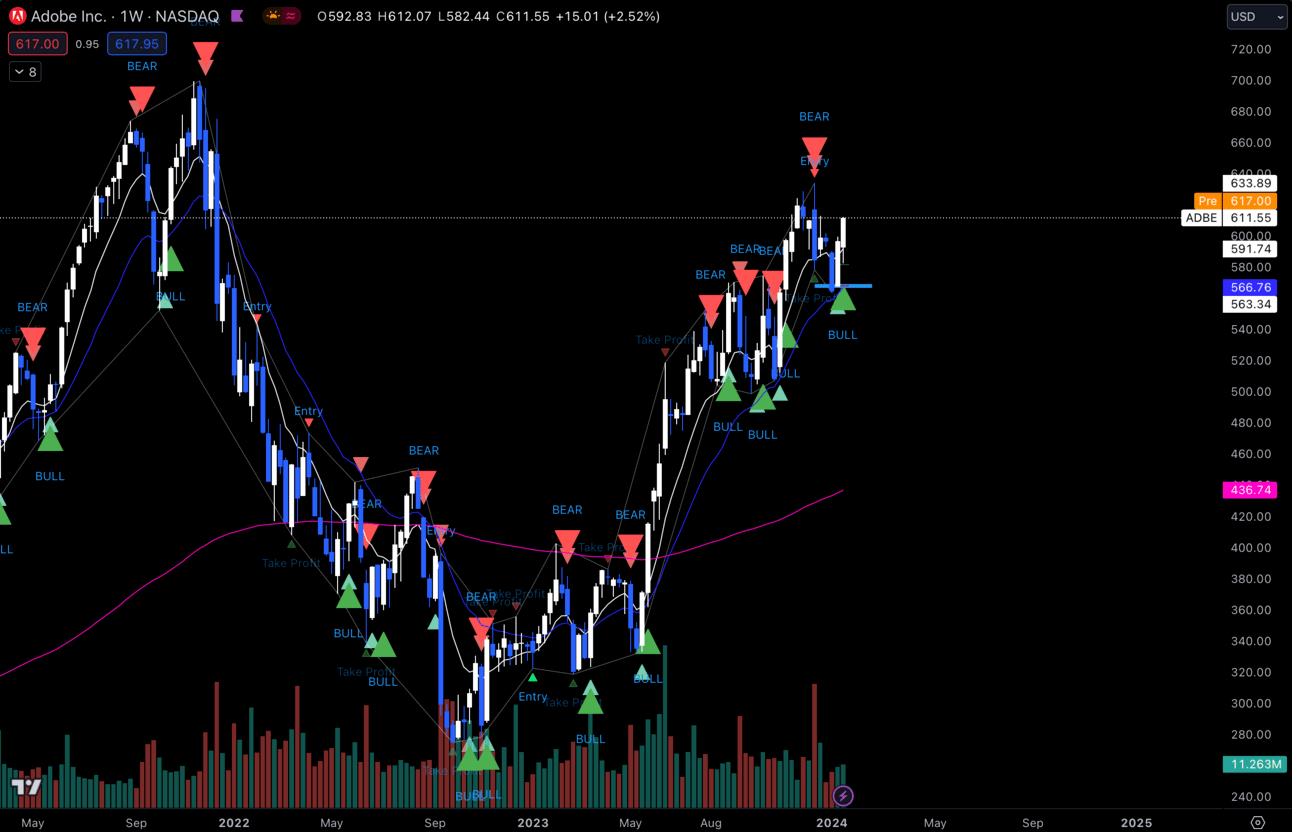
$ADBE Weekly
Loving the weekly here, perfect bounce off the EMAs which was also just a basic retest of previous consolidation. Looking strong, but we need that breakout!
3. $MARA
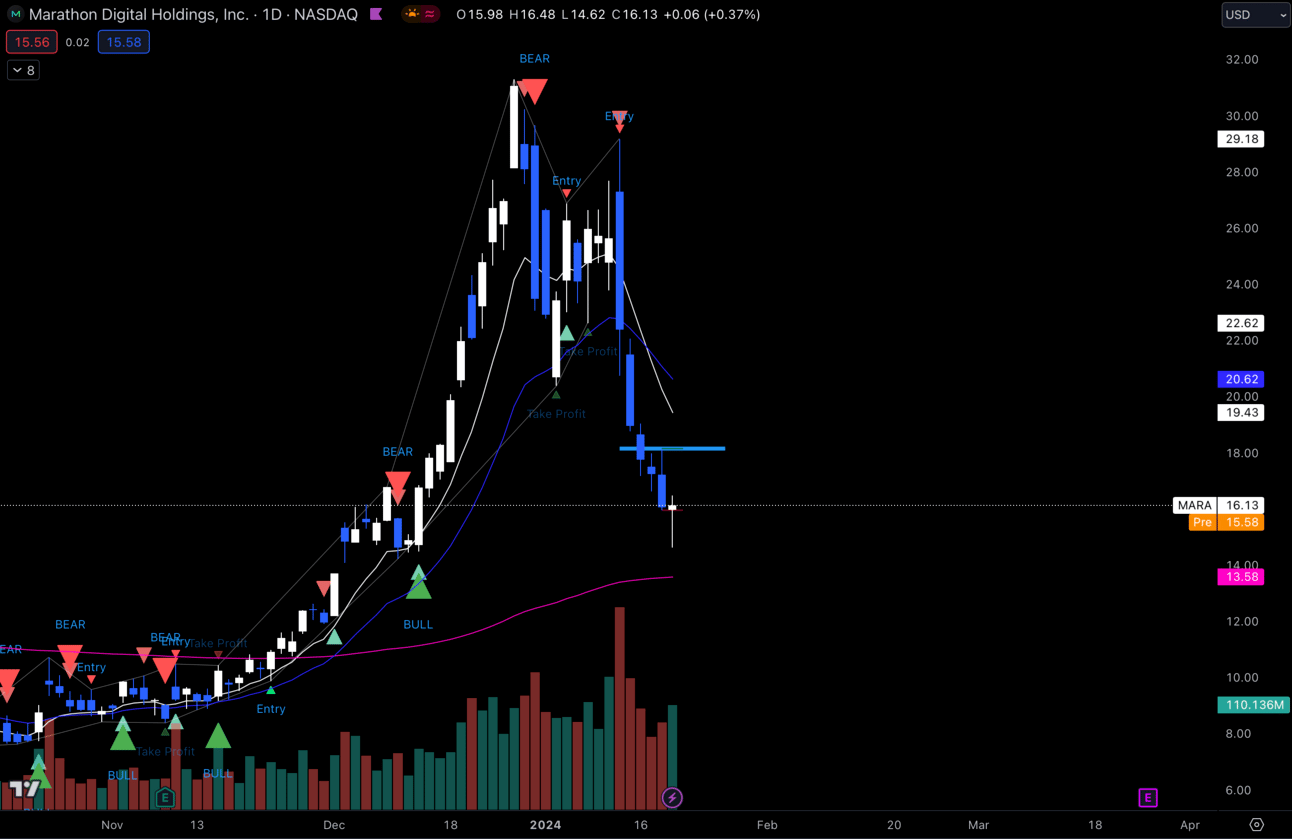
$MARA Daily
$MARA has been getting hit hard recently, but we are coming in right to my 200 EMA on the daily which is a big spot I expect it to hold.
Getting a doji candle already which could be the sign of a possible reversal but I wouldn’t bet my chips on that personally. Would love to see it actually hit my 200 EMA, but if not i’ll be waiting for a trigger to tell me to get in.
Which would be a daily close above previous days high. Either way I think this sell of on $MARA has been a little overdone, but we’ll see!
Long-Term Setups For This Week:
1. $TSLA
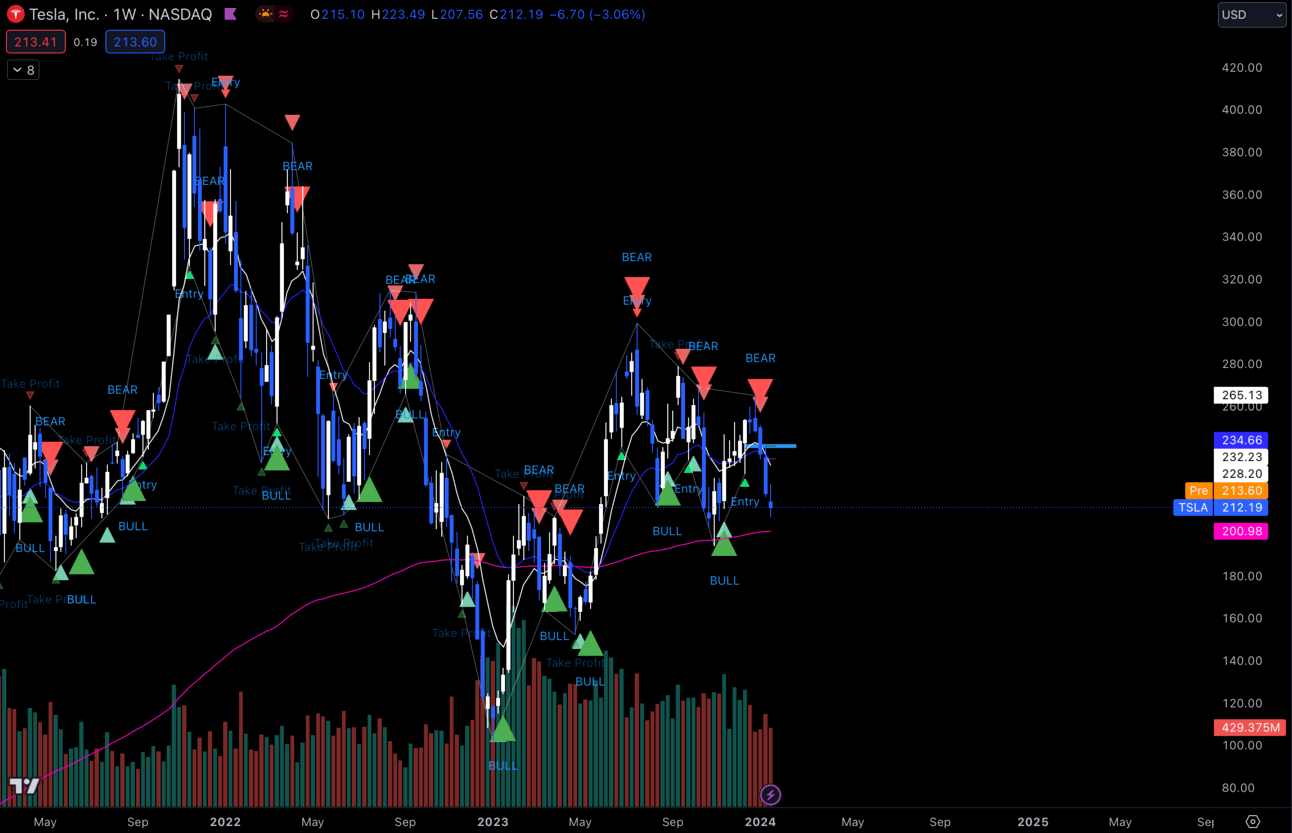
$TSLA Weekly
I’ve been buying more $TSLA ever since we got back under $220. Like i’ve said before I love this stock for the long-term portfolio and it is just giving us another opportunity to get more shares at a reasonable price.
We do have earnings for $TSLA on Wednesday, so if you aren’t open to taking to much risk, it might be smarter to wait until after earnings and let the dust settle.
I’m personally okay with taking the risk, that’s why i’ve been adding. I know if $TSLA were to rip on earnings, I would be mad I didn’t get any shares before and if it were to drop I wouldn’t be too concerned about it.
2. $SNOW
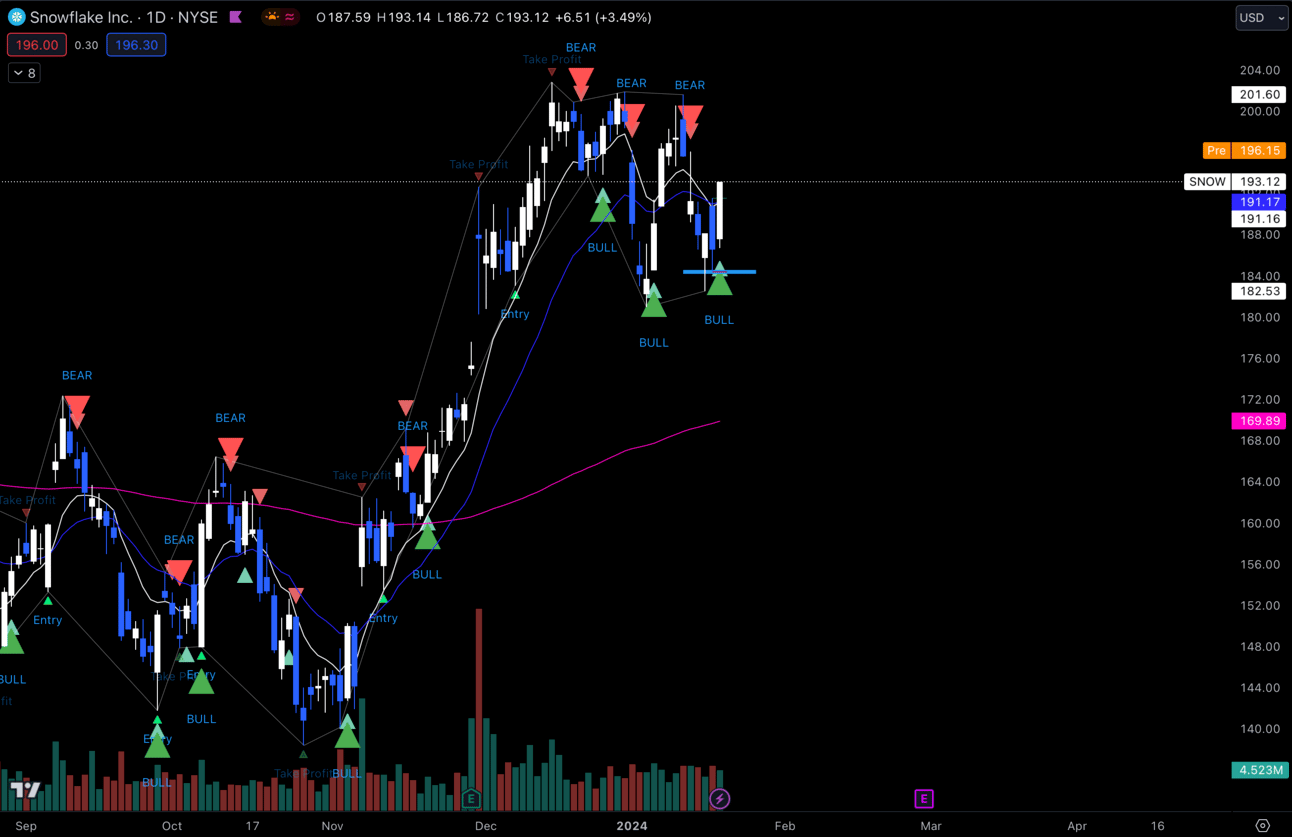
$SNOW Daily
$SNOW is making a higher low on the daily. I was trying to pick up shares around my 200 EMA, but it doesn’t look like we are going to get there.
I’ll likely be adding some more shares this week anticipating the breakout on the daily. Zoom out to the weekly/monthly chart and you can see how much upside potential is here.
Economic Calendar:
These data points are known to bring volatility during the intraday.
Tuesday 1:00 EST, 2-Year Note Auction
Wednesday 10:30 EST, Crude Oil Inventories
Wednesday 1:00 EST, 5-Year Note Auction
Thursday 10:00 EST, New Home Sales
Thursday 1:00 EST, 7-Year Note Auction
Friday 10:00 EST, Pending Home Sales

Trending Sectors:
Technology, Healthcare and Consumer Services were at the top of the leaderboard for trending sectors last week.
Energy, Materials, and Industrials were the weakest performing sectors out of the week.
These tickers saw the most inflow last week:
$KNX
$AN
$CR
$BYD
Have A Great Week!
As always enjoy the week and let’s continue to play smart and capitalize on the market when the moves are provided. Happy trading everybody!
Discord:
Access to all of my trades as well as 5 other analysts’ trades.
Daily livestreams from my mentor.
Real-Time Live Market Talk. (No delay like there is with X Spaces)
EDU Channels/Access to EDU Content.
Easy access to talk with me.