- Ace in the Hole
- Posts
- Ace in the Hole - Edition #4
Happy Monday Traders!
We have a big trading week ahead of us, so get ready. Last week, FOMC Minutes data came out which revealed that several officials believed interest rates could stay at its peak for a longer period than expected.
This resulted in very “whipsaw” price action for $SPY/$QQQ and we ended up closing slightly below the levels we were at before FOMC Minutes were released.
In my opinion it was a pretty boring move intraday, but did bring a bit more volatility than FOMC Minutes have previously.
What Does This Mean For Us Traders/Investors?
From a day trading perspective, these types of events are great catalysts to create volatility during the intraday. Especially when there isn’t much volume in the market.
For investors, I don’t think this event was a massive deal. Stock market remained resilient and the FOMC Minutes had a minor effect on the performance.
Things to take note as a long-term investor:
Interest rate hikes: FED has been raising interest rates to combat inflation, which has been effecting the market and the broader economy.
Market volatility: Investors should expect to see short-term volatility on their positions which can mean seeing substantial fluctuation in price, but I wouldn’t let it scare you out of solid companies.
Economic indicators: It’s a good idea to keep an eye on GDP growth, unemployment rates and inflation data. These data points provide insight into the health of the economy.
Sector performance: Certain sectors may be more sensitive to interest rate changes than others. Financial sectors may benefit from higher interest rates while utilities may be negatively effected.
Diversification: As you’ve probably heard, it’s smart to keep a well diversified portfolio to mitigate your risk.
Short-Term Setups For This Week:
1. $SPY
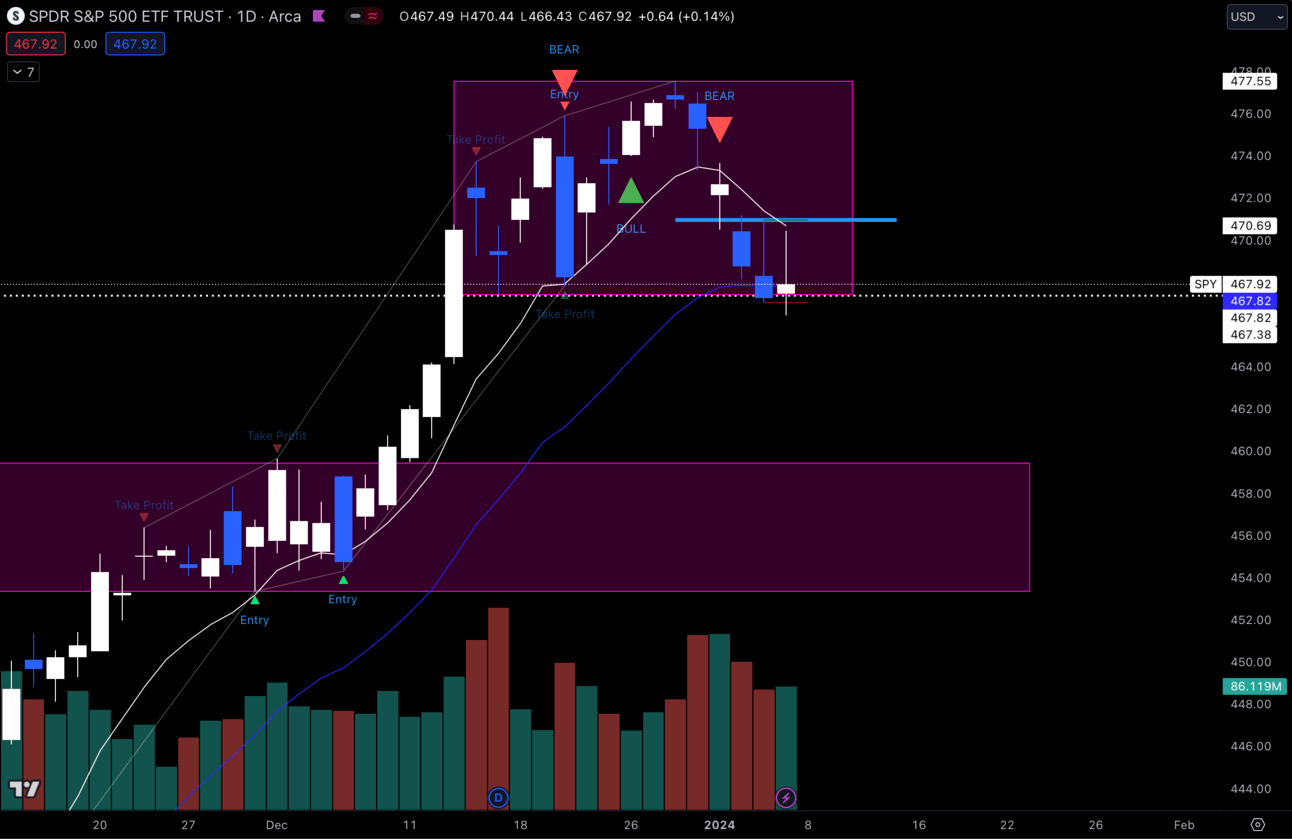
$SPY Daily
Looking at the $SPY daily chart, we are still stuck in this range. I want to see us make a move from the bottom of this range at $468 down to $460. We could definitely stay in this range and move back up, but I think we are looking weaker here.
$460 is the breakout level from early December which we never retested after making that impulsive move up. No matter how strong a move might be, I always anticipate a retest after breaking out/down.
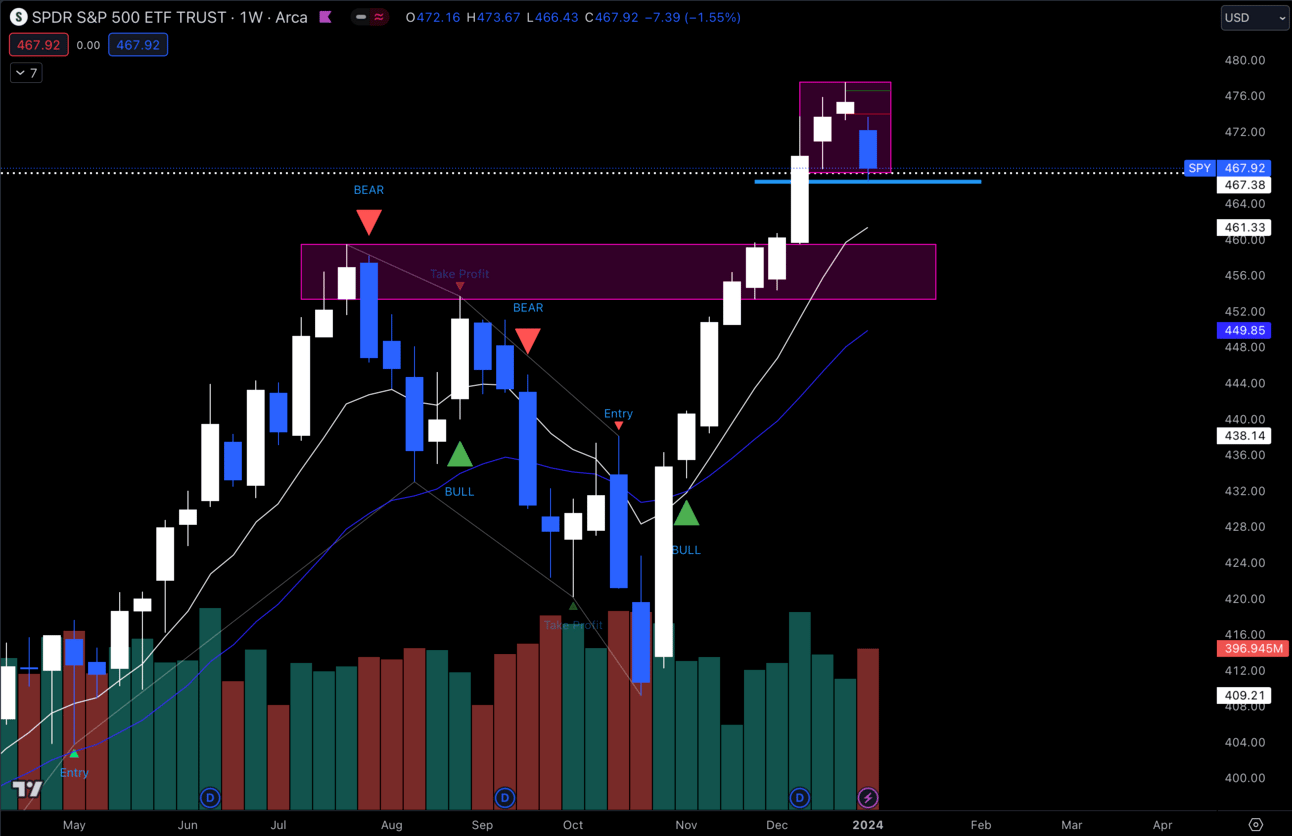
$SPY Weekly
If you look at the weekly chart you can see that $460 would also be a retest of July highs which matches up pretty closely with the weekly 9 EMA as well.
Having these multiple points of confluence makes me think that the retest is coming, but anything can happen, so I won’t be surprised if we stay in the range and go higher from $468.
2. $MSFT
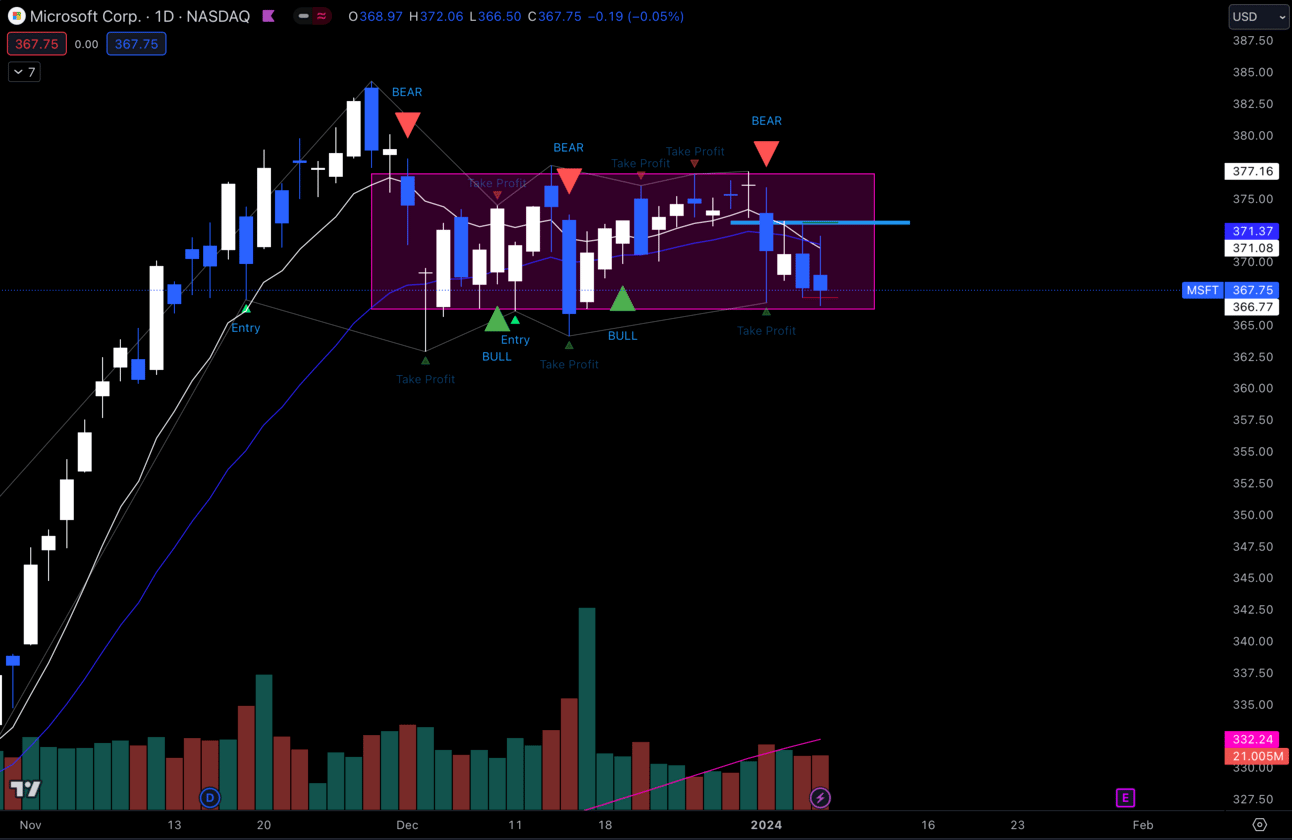
$MSFT Daily
$MSFT has been in this range for over a month, but usually the bigger the consolidation, the bigger the move. Hopefully this long consolidation will provide us with a solid move out of this range.
I’m not a Bull or Bear here, i’m just waiting for a break of the range to capitalize on.
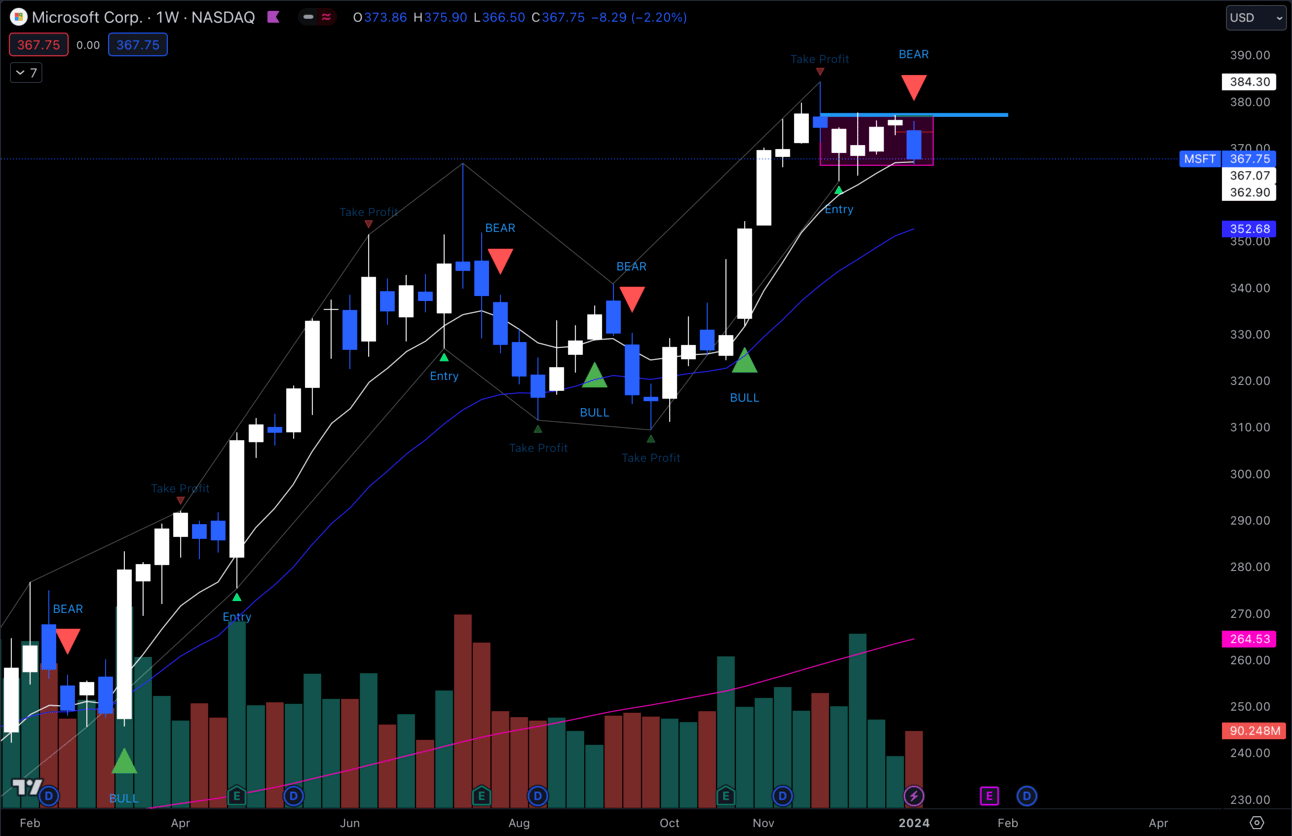
$MSFT Weekly
I would note that $MSFT is retesting its July highs and the weekly 9 EMA, so its very possible we hold here.
If it doesn’t hold, i’d like to see a move down to the 21 EMA on the weekly which is around that $352.50 area.
3. $TSLA
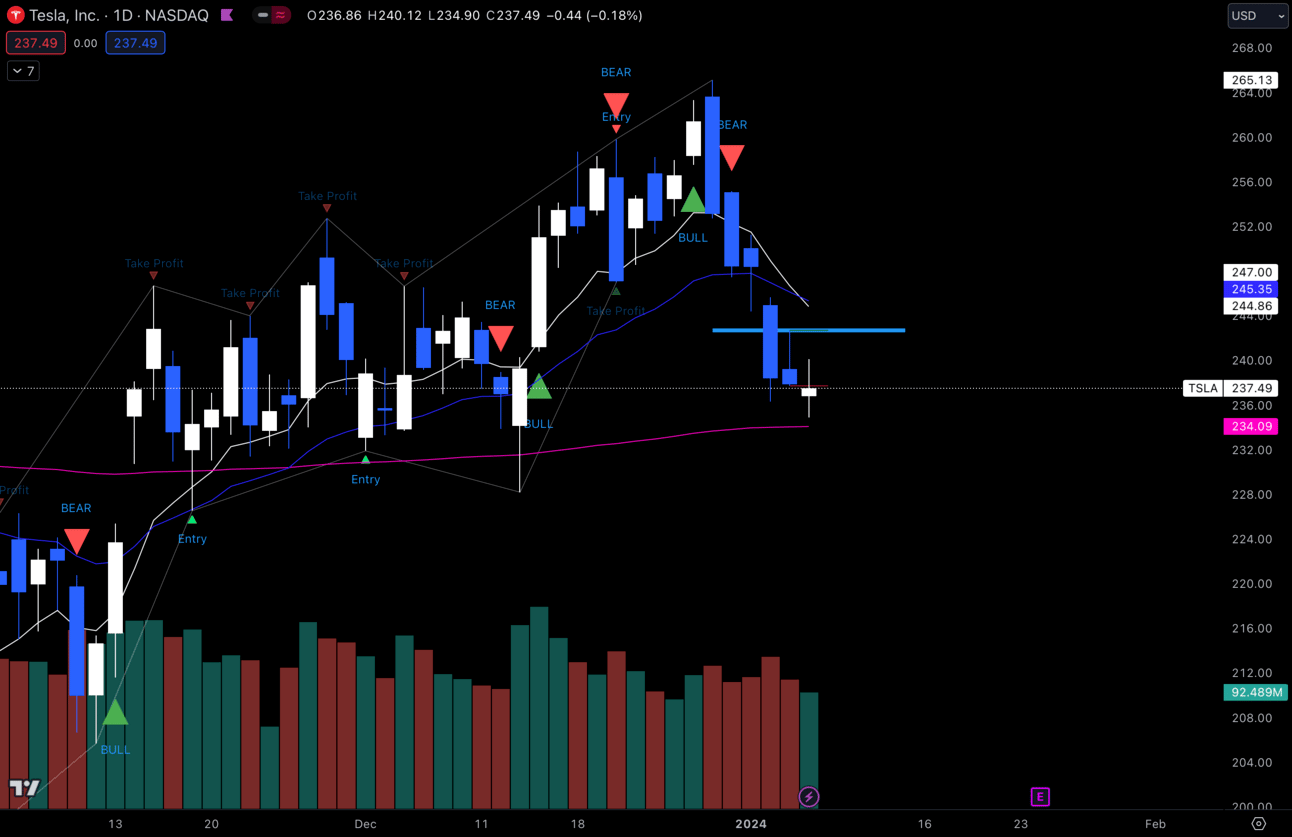
$TSLA Daily
$TSLA is back at the bottom of its daily range and also retesting 234 which is my 200 EMA. If it were to bounce here it would also be making a higher low in the range.
If there are signs of buyers around this 200 EMA, i’ll likely be playing intraday calls, but if she can’t hold and loses that 200 EMA i’m going to look to possibly play puts targeting that 224 over the next few days.
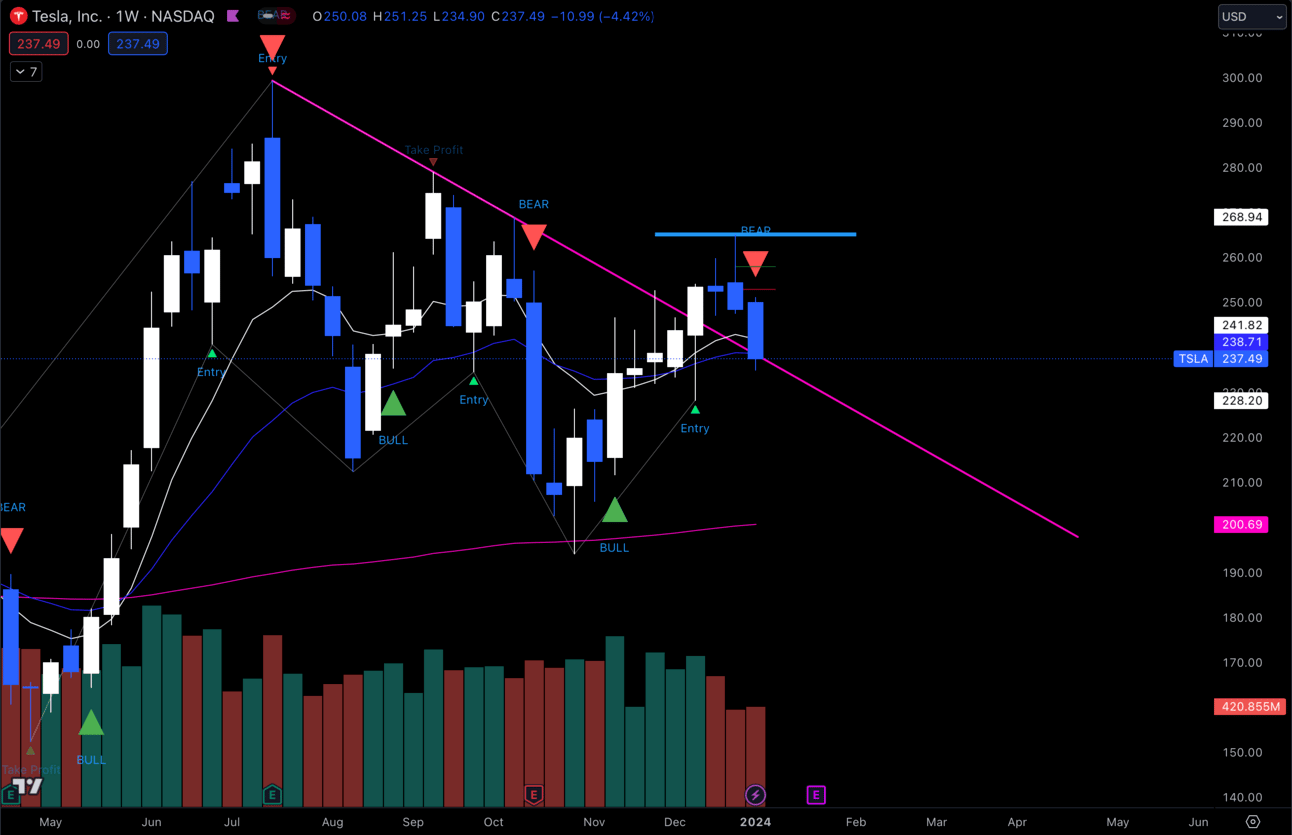
$TSLA Weekly
The weekly is looking good for the Bull thesis as well. We are retesting the breakout of the trend which is also the weekly 9 and 21 EMA, so again as long as we hold those I still like the Bull thesis.
4. $PYPL
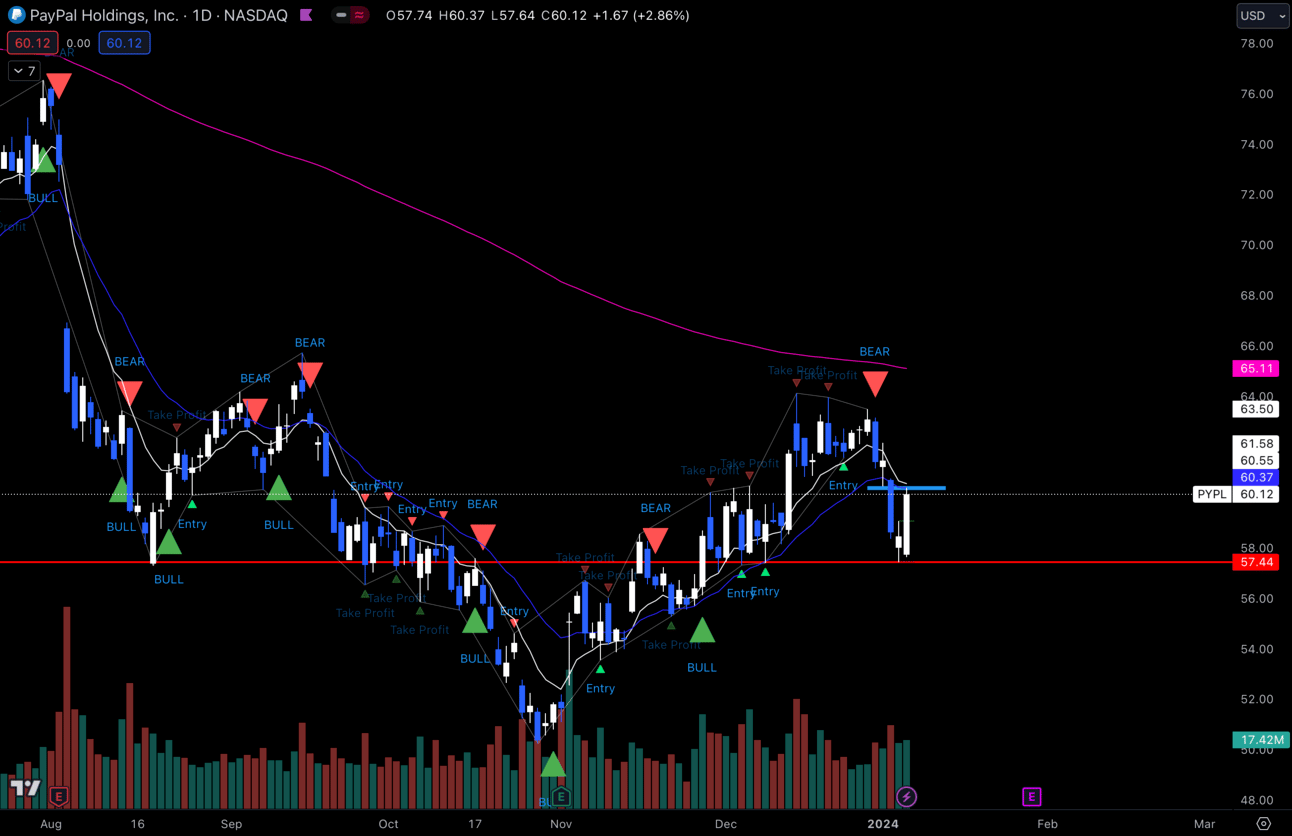
$PYPL Daily
The $PYPL daily caught my eye last Friday. Beautiful bounce off of that $57.50 area which is a solid support from August. Would like to see if this momentum can continue and go back to test the highs around $64 and maybe even try to test my 200 EMA at $65.
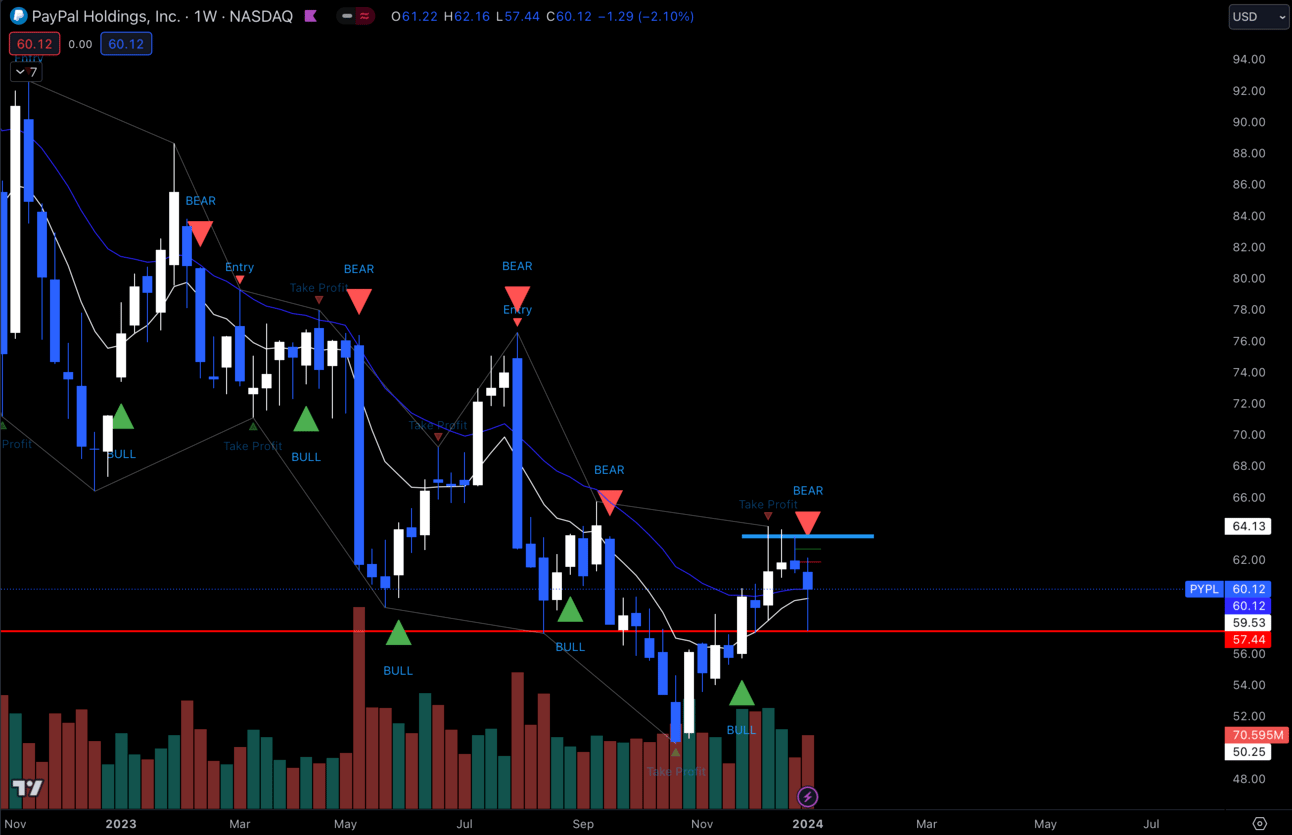
$PYPL Weekly
The weekly chart is looking solid holding the 9 and 21 EMA and bouncing perfectly off of that $57.50. Looks constructive, but if we got under $57 this thesis will be invalidated.
Long-Term Setups For This Week:
1. $SNOW
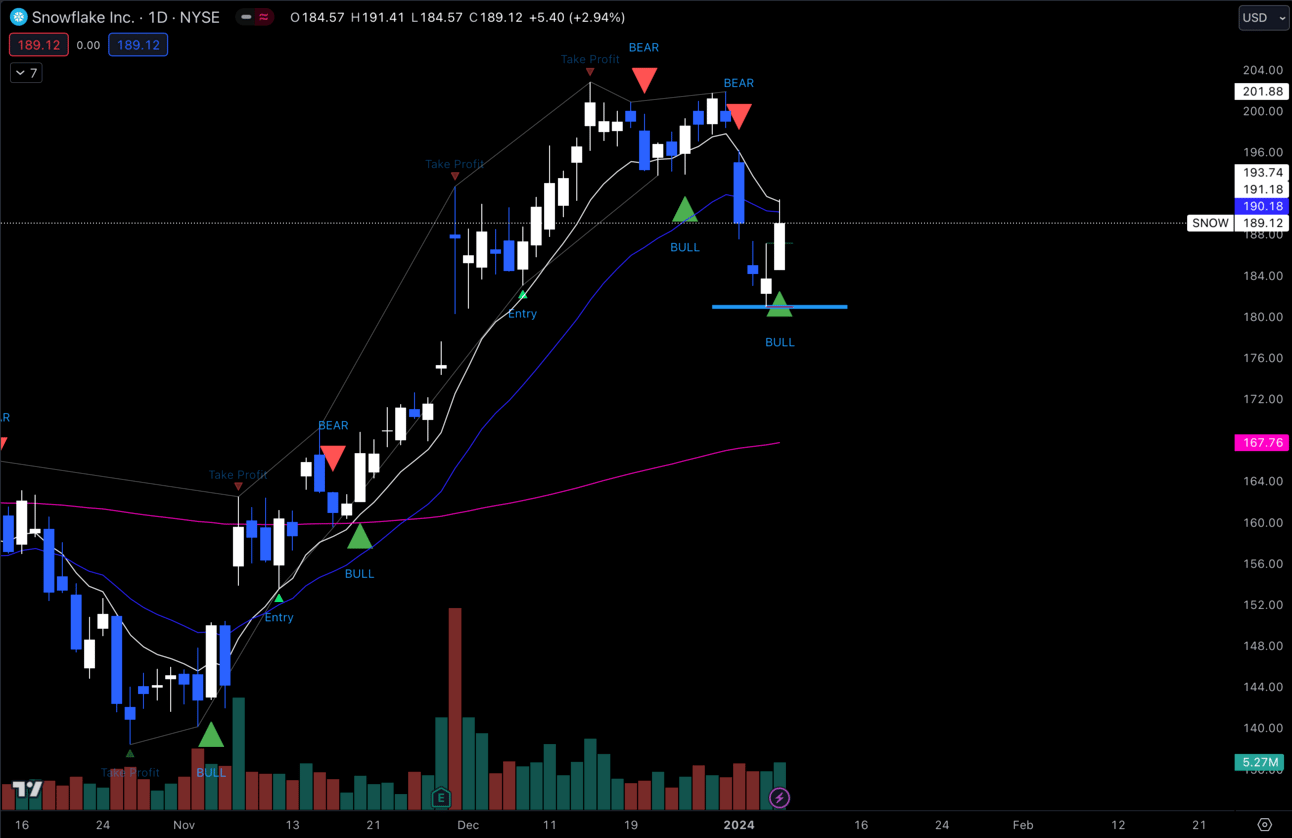
$SNOW Daily
I’m liking $SNOW around this $180 area to add some shares for the long-term portfolio. Ideally we get a dip to that 200 EMA around $170 and pick up shares there.
Either way I think $SNOW has a lot of room upside from here, especially if you are taking a look at the weekly chart.
I don’t really have anything else on my radar for long-term adds right now. Like I said before, i’ve been sitting with the positions i’ve added during October, so i’m just going to continue to ride those out.

Economic Calendar:
These data points are known to bring volatility during the intraday.
Monday 12:00 EST, FOMC Member Bostic Speaks
Wednesday 10:30 EST, Crude Oil Inventories
Wednesday 1:00 EST, 10-Year Note Auction
Thursday 8:30 EST, CPI
Thursday 8:30 EST, Initial Jobless Claims
Thursday 1:00 EST, 30-Year Bond Auction
Friday 8:30 EST, PPI

Trending Sectors:
Last week was a pretty mixed bag in terms of trending sectors. Technology, Communication Services and Consumer Cyclical led the pack in terms of growth.
Here are the tickers that saw the most inflow last week:
$CMRE
$GSL
$CSCO
$SONY
$PGR
$UBER
$DKNG
$CRWD
$X
$PEP
Have A Great Week!
As always, everybody enjoy this week of trading and be safe! Tons of economic data coming out, so play smart!
Discord:
Access to all of my trades as well as 5 other analysts’ trades.
Daily livestreams from my mentor.
Real-Time Live Market Talk. (No delay like there is with X Spaces)
EDU Channels/Access to EDU Content.
Easy access to talk with me.