- Ace in the Hole
- Posts
- Ace in the Hole - Edition #1
Happy Monday Traders!
It’s the start of another round of trading!
Last week we had a ton of craziness going on in the markets with Fed Chairman Jerome Powell talking about how inflation has eased and the Fed is no longer planning a rate hike.
He mentioned that the FOMC median forecast now shows three rate cuts in 2024, and the Fed is committed to returning inflation to the 2% objective.
To provide more context, the Federal Reserve has been raising interest rates to combat inflation. However, recent data shows that inflation is cooling, and the Fed believes that they have made significant progress in tackling the issue.
Powell's speech also indicated the Fed is now shifting its focus to maintaining a restrictive monetary policy stance for some time.
This means the Fed will continue to keep interest rates high to ensure that inflation remains under control.
In conclusion, the Fed's recent FOMC speech indicates that while inflation is easing, they remain committed to maintaining a restrictive monetary policy stance for now. The Fed is also projecting three rate cuts in 2024, but this is subject to change based on future economic conditions.
What Does This Mean for Day Traders/Investors?
For intraday trading, I say this means nothing really. Keep going about your setups and following your plan.
FOMC brought us volatility and that’s all I think it is for the day traders.
Don’t go to deep into it IMO, play the charts and volatility in front of you and stay consistent.
DAY TRADERS SCROLL DOWN FOR SETUPS TO WATCH THIS WEEK!
As for the investors, you should focus on the following key areas:
Monitoring the Fed's monetary policy decisions and their impact on the markets.
Keeping an eye on inflation rates and unemployment data to gauge the overall health of the economy.
Assessing the performance of various sectors, such as housing, manufacturing, and retail, to identify potential investment opportunities.
Staying informed about interest rates, the US dollar, and global economic developments that may influence investment decisions.
Considering the potential impact of political events and policy changes on the financial markets.
STAY TUNED TO HEAR ABOUT LONG-TERM SETUPS I’M WATCHING!
Short-Term Setups I’m Watching for this Week:
1. $SHOP
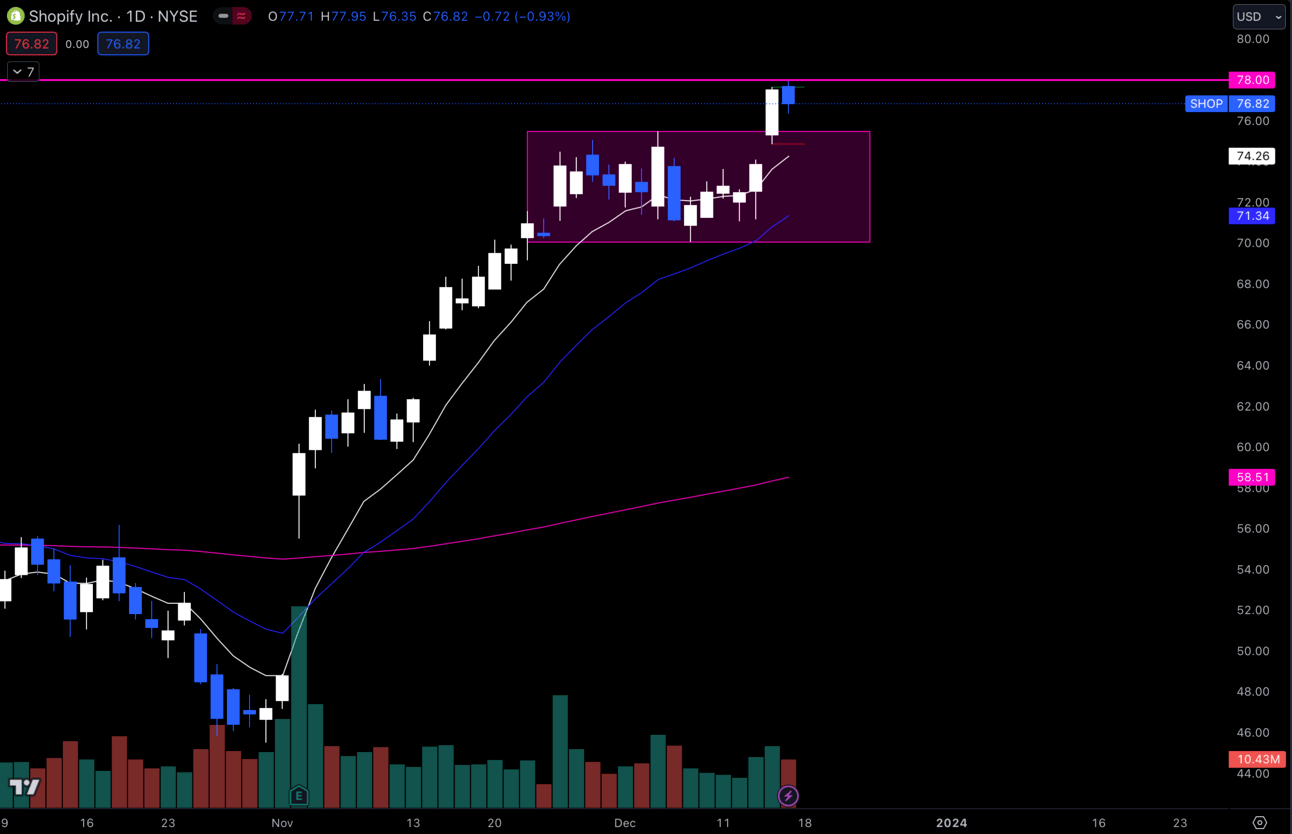
$SHOP Daily
The $SHOP daily chart is looking really good here. I’m seeing a strong breakout from that $70.04 —> $75.47 range, and I’d like to see it hold $76 and get over that $78 which is support back from January and is now the next resistance.
I personally wouldn’t let any dips on this name scare you unless $75 is lost. Anything above that is a buying opportunity IMO.
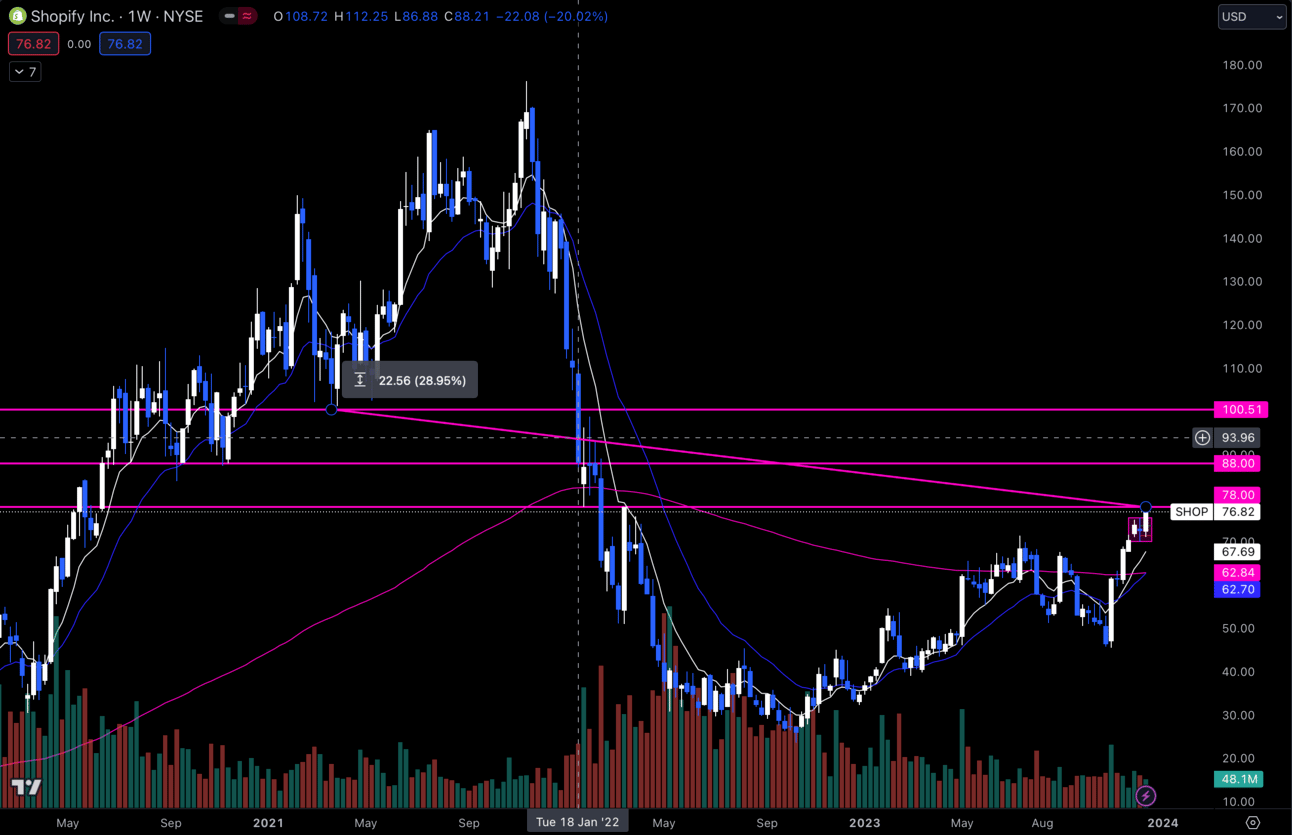
$SHOP Weekly
Zooming out to the weekly chart, I noticed some big areas to watch out for if this trend on $SHOP continues.
After $78, I see $88 which is support from July, September and November of 2020. If we can clear $88, I think we have a pretty smooth shot to $100.51 —> $102.50.
From where $SHOP is now to $100.51 there is 28.95% of upside to take advantage of and about half of that if we only make it to $88. Definitely lots of opportunity here!
2. $TSLA
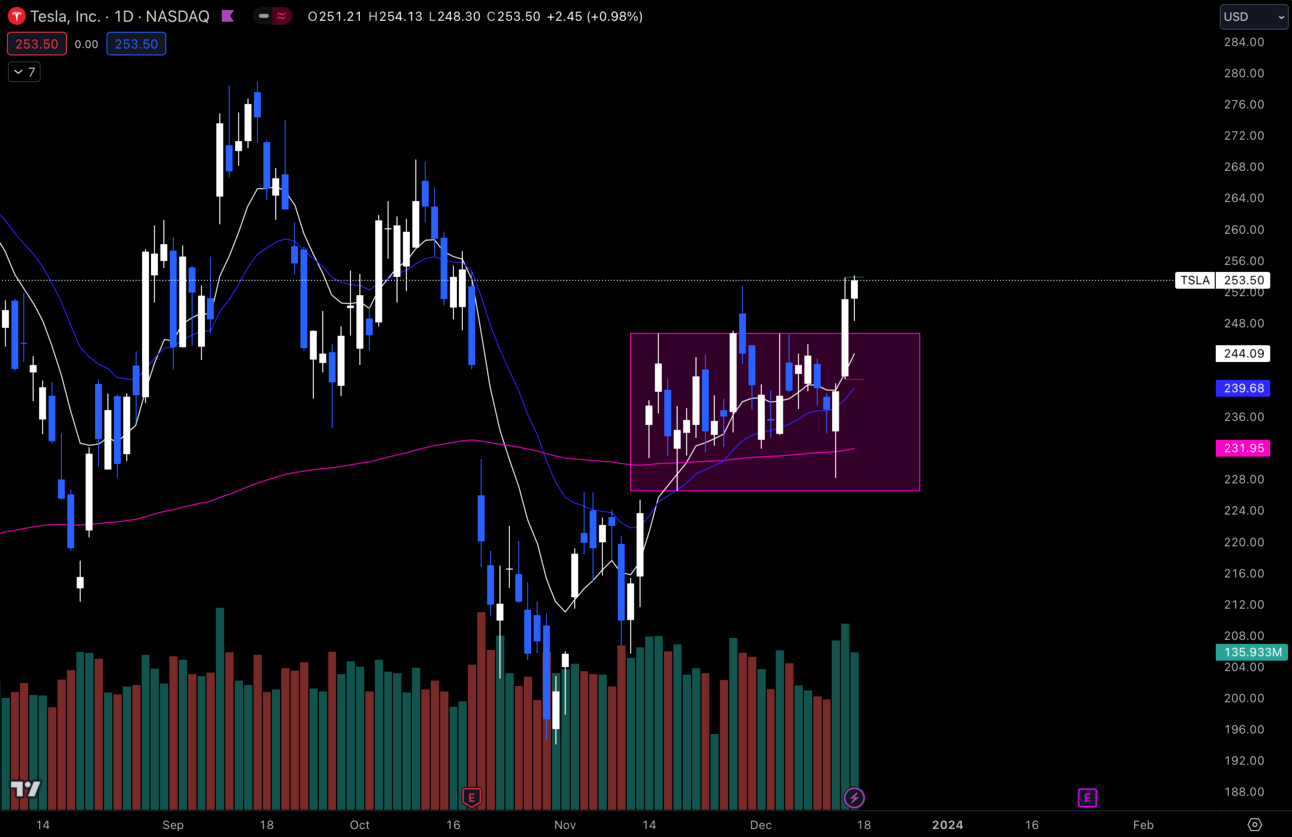
$TSLA Daily
The $TSLA daily chart is also looking very strong, getting a breakout of that range from $226.54 —> $246.70.
As long as it can hold above $244 I will still like this name for upside to $300 and will look at dips as buying opportunities.
I really think we could be in for a massive rally on $TSLA soon. Scroll down to see why.
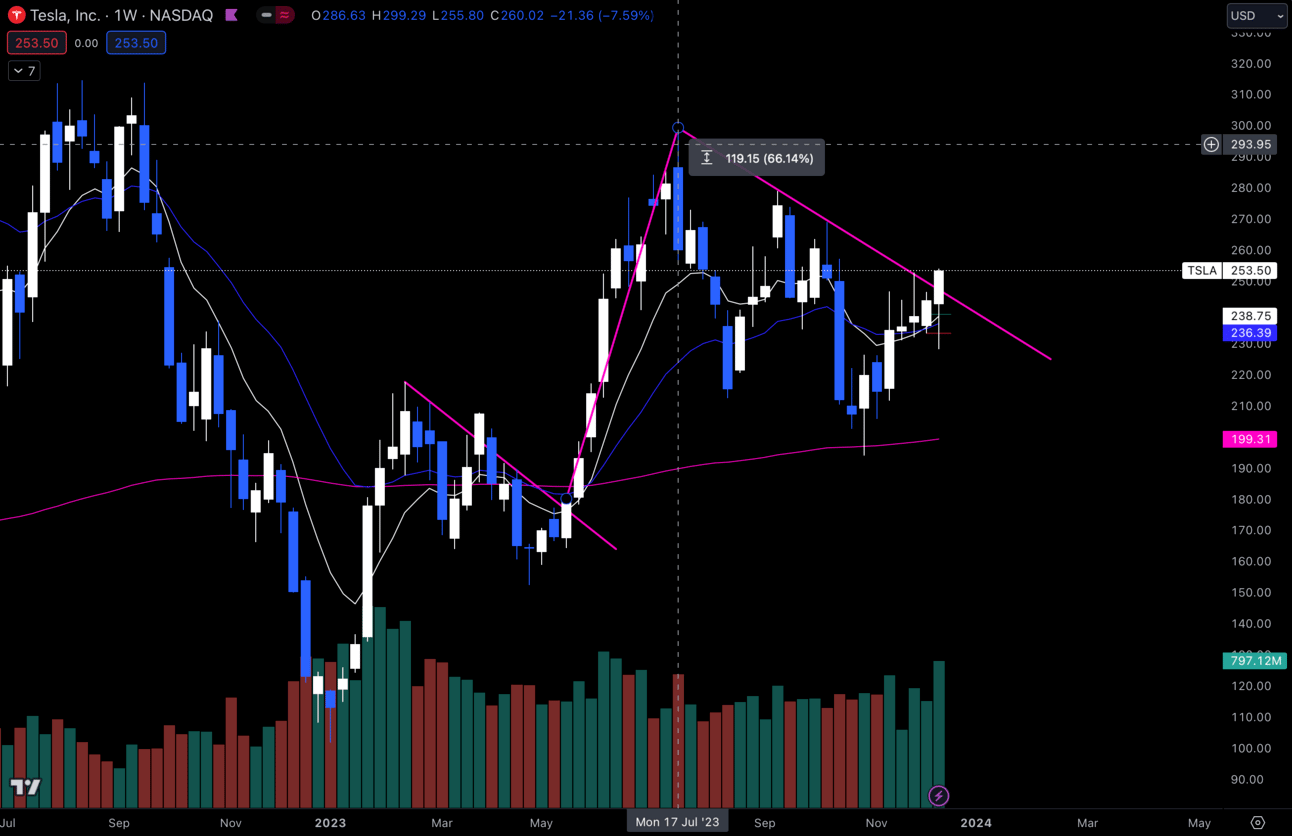
$TSLA Weekly
Zoom out and take a look back to April, May and June of this year on $TSLA.
You can see on the weekly and the daily, a wedge pattern that happened back in April and then carried on rallying through May and June.
I think we are about to see a repeat of this.
Looking at today’s chart, I see a very similar wedge pattern that has been forming. We are really starting to pick up momentum on the weekly and daily charts and last week ended up closing very strong, breaking out of the wedge pattern.
Last time $TSLA rallied, it went up 66.14% before pulling back and starting the wedge pattern we are in now. If we were to rally another 66.14% from where we are now, $TSLA would reach $421.16.
Even if it only did half of that move, $TSLA would reach $337.33.
Feeling very optimistic about this setup, but I always know that anything can happen. No matter how “good” the setup might be, sometimes it just doesn’t work out and you should always prepare for the worst.
3. $IWM
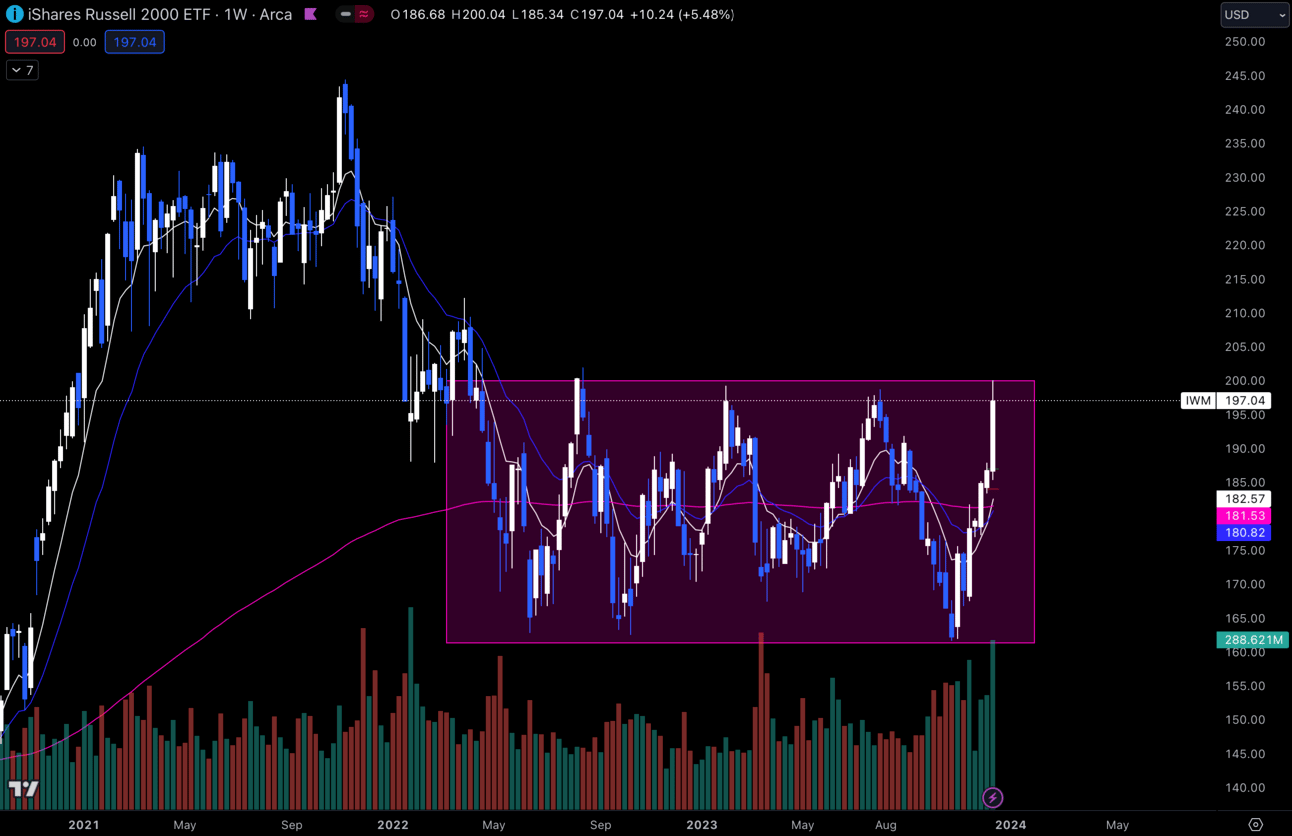
$IWM Weekly
$IWM is retesting the top of this range at $200 and I personally think we are going to get a move and hold above this range.
Lots of momentum on this move up and we’ve already had a strong breakout on the daily chart. I’ve been day trading $IWM on the recent breakout, but I definitely think a move over this $200 and continuation is possible.
This name has underperformed massively relative to the $SPY, so I personally think that there is a lot of room to the upside.
Long-Term Setups I’m Watching for this Week:
1. $CELH
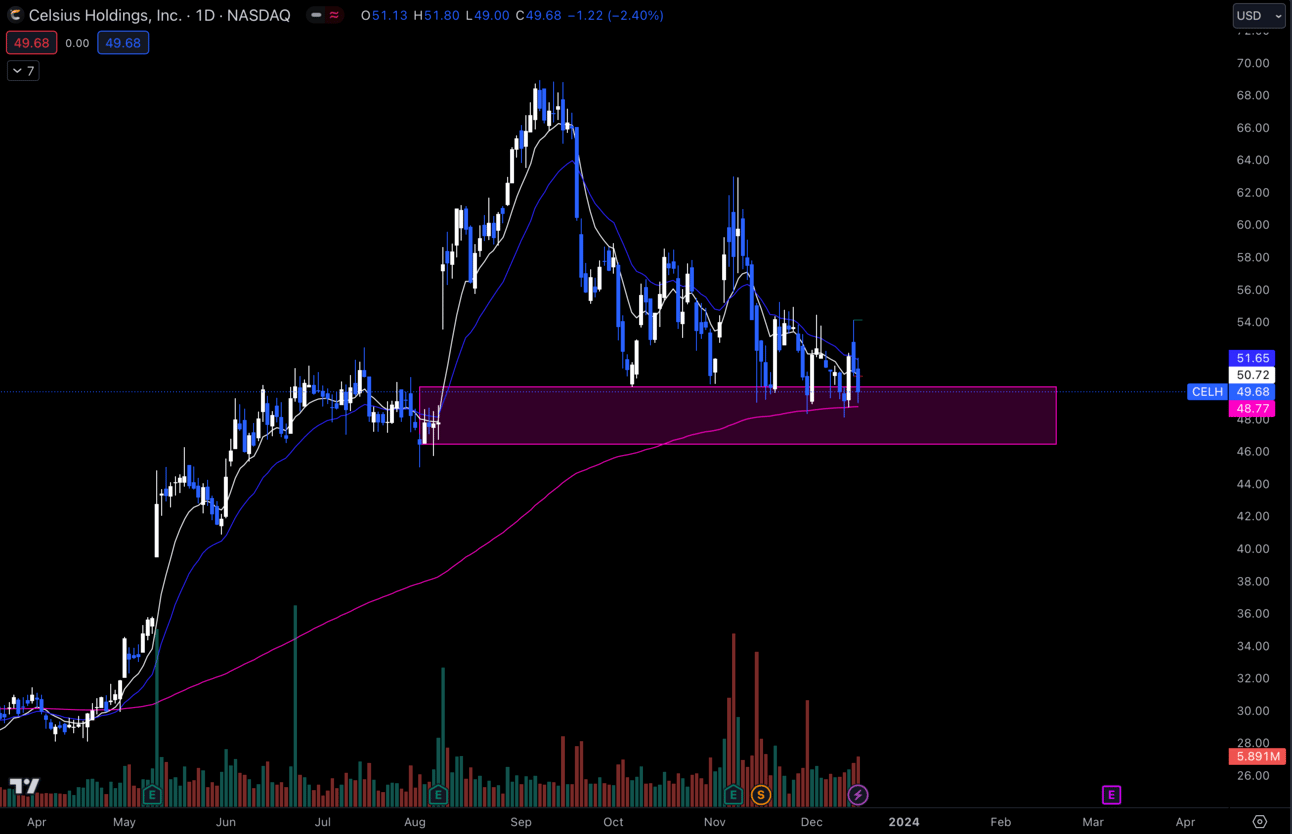
$CELH Daily
$CELH is looking interesting, I’m not going to say, “I love it”, but I have been adding small amounts in my long-term account anytime we get under $50.
The purple zone you see on the chart is my “buy zone” for now. Although, I’m not adding large amounts because as much as I want this to continue higher, if $CELH gets under $45 I’d stop adding and wait to see if I can get this name at $40 or possibly under.
Either way, I do like this name for my long-term and will continue to add small amounts until the chart tells me otherwise.
2. $TSLA

$TSLA Weekly
I already explained my thought process above in the short-term setups, but the same applies for the long-term.
I was adding more shares to this name in the $200—>$220 range and I think I may add some more on any solid dips we get before this “potential” rally comes.

Economic Calendar:
These data points are known to bring volatility during intraday trading:
Wednesday 10:00 EST, Existing Home Sales
Wednesday 10:30 EST, Crude Oil Inventories
Wednesday 1:00 EST, 20-Year Bond Auction
Thursday 8:30 EST, GDP
Friday 8:30 EST, PCE

Expectations:
I’m expecting a good amount of volatility for intraday traders this week with some of the data points that are coming out, but $SPY has had a solid run and we are up another 2.5% from the recent consolidation.
As much as I hate it, we could be starting to chop again.
I am by no means trying to heavily short this market at all. Not until the charts give me a good reason.
But I wouldn't be surprised to see a healthy pullback towards the top of our recent consolidation or at least a 50% retrace of the move up.
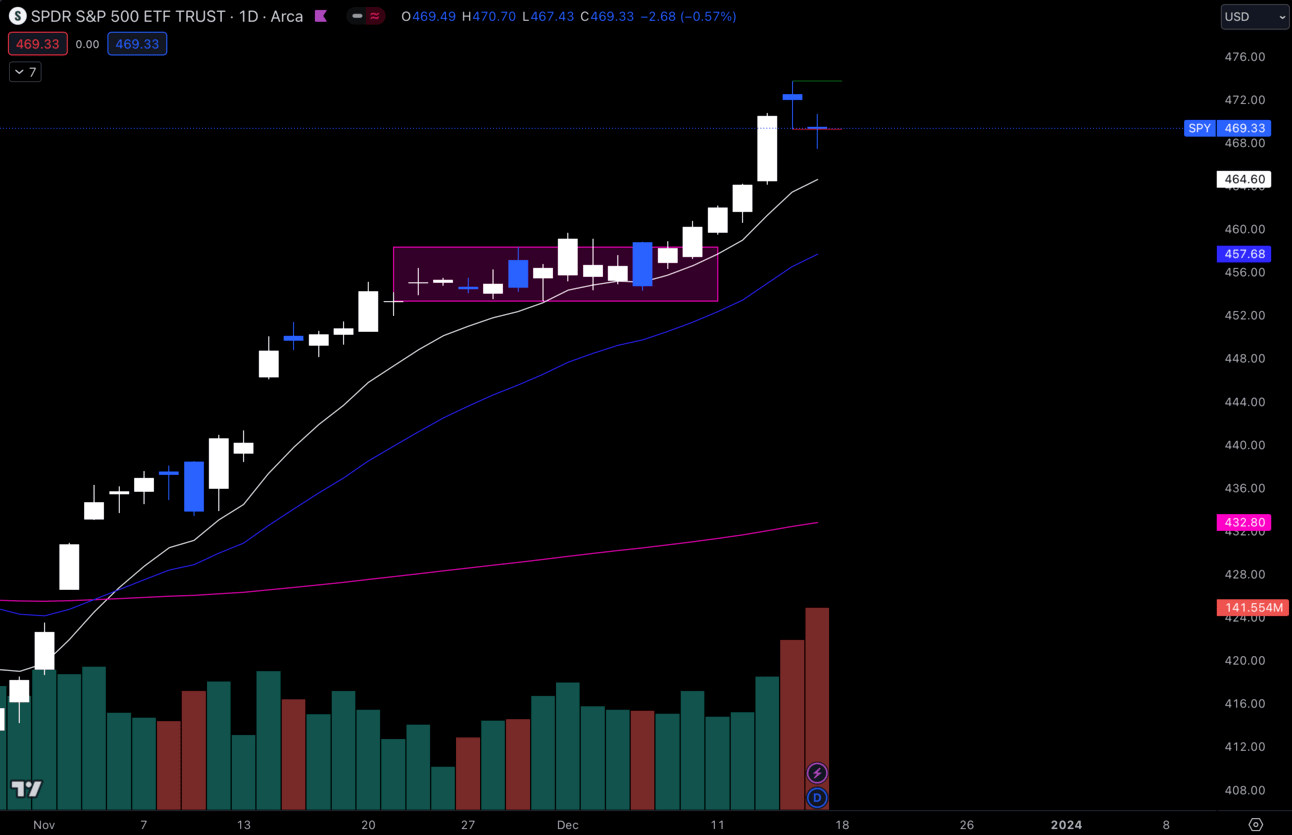
$SPY Daily
No matter what happens, I’m expecting volatility this week, but after the significant moves we’ve had to the upside I think it’s possible we get a bit more ranging price action. Which could actually make for some pretty good intraday trades, so I don’t mind if we can’t trend higher just yet.
Trending Sectors:
Last week we saw a lot of money rotating into Tech and Communication Services with some notable inflow coming in for consumer discretionary, industrials and financial sectors.
I also think it’s worth noting that buyback activity has been accelerating, with inflows surpassing seasonal levels for the 5th consecutive week.
Here are the tickers that saw the most inflow last week:
$TTWO - Take-Two Interactive Software, Inc.
$TZOO - Travelzoo
$META - Meta Platforms, Inc.
$GOOG - Alphabet Inc.
$DASH - DoorDash, Inc.
$WMG - Warner Music Group Corp.
$NXST - Nexstar Media Group, Inc.
$IAS - Integral Ad Science Holding Corp.
Sectors such as utilities and consumer staples experienced some notable outflows last week.
Have a Great Week!
If you made it this far, I hope you have a great and safe week trading. Let’s start this week off with a BANG!
Discord:
Access to all of my trades as well as 5 other analysts’ trades.
Daily livestreams from my mentor.
Real-Time Live Market Talk. (No delay like there is with X Spaces)
EDU Channels/Access to EDU Content.
Easy access to talk with me.